HGTV is a major influence on how popular culture thinks of real estate and helps shape popular design trends with shows that include Love It Or List It, Property Brothers and House Hunters. They’ve made my job easier by giving buyers a script to follow when looking at homes and bringing entertainment and enthusiasm to real estate sales. They now even publish a magazine. But they are not statisticians or investigative reporters.
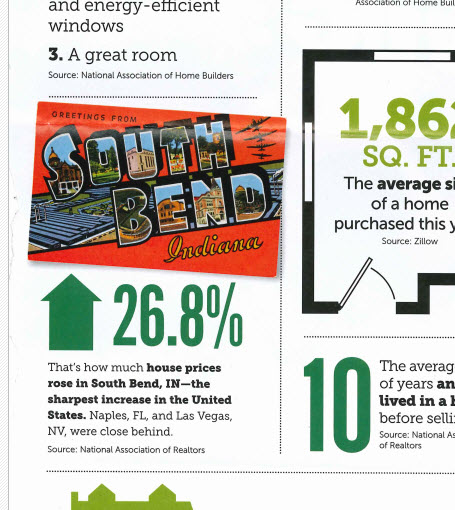
The HGTV magazine recently reported that house price appreciation in South Bend is “the sharpest increase in the United States” at 26.8%.
It’s an impressive figure that just missed making a lot of marathoners smile and it is getting a lot of attention locally. But it doesn’t fit with what I see looking at houses and property sales here everyday: If you bought a house here a year ago for $200k, you’re probably not going to get $253,600 for it today unless there are some very special circumstances. So I had to look further into the figure.
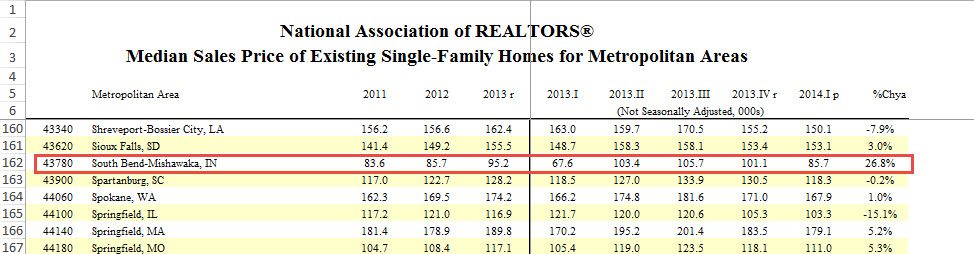
HGTV cited the National Association of Realtors (NAR) as its source. When I couldn’t find a press release from NAR, I contacted them for greater detail. The 26.8% rate quoted is the year-over-year increase in the median price of sales from the first fiscal quarter (Jan-March) of 2013 compared to the first quarter of 2014. The lag is likely due to the lead time between a magazine article being written and the publication hitting the bookstore.
That means the technical answer is that yes, that’s the calculated appreciation and HGTV is not wrong. But they’re not quite right either, the 26.8% figure requires the following explanatory notes:
- This data is from the census defined statistical area or Core Based Statistical Area- CBSA 43780 – and not from the city limits of South Bend. It includes sales from South Bend, but also from Mishawka, Granger, Osceola, Lakeville, and parts of Michigan including Edwardsburg and Cassopolis.
- The data is old, ending more than nine months ago in March 2014.
- The data is sourced from the relevant MLS es. It’s probably the cleanest data set, but it does excludes many new construction and For Sale By Owner sales.
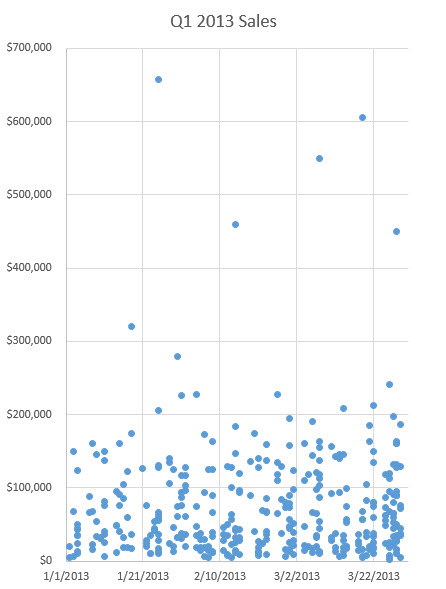
When I recreate the investigation with sales data for just South Bend, with data I manually pull from the same MLS, I see that
for Q1 2013, there are
- 366 sales
- median sales price of 49k
- 102 of the sales were for 25k or less.
And for Q1 2014, There are
- 298 sales
- median sales price at 70k
- 65 of those sales were for 25k or less.
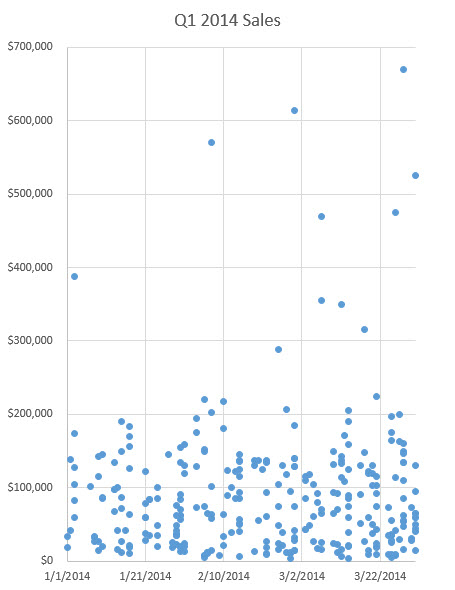
Simply, it means that if the data is for “South Bend” and not “South Bend and the nearby cities,” the bulk of the reason the prices went up was that were were a lot of low price sales in Q1 2013 and fewer of them in Q1 2014. It wasn’t because the house at 123 Main Street went from $100,000 to $127,000. The “mix” of homes sold changed, more than the values did.
So, the data is “true” if misleading. But interestingly, it also underreports the appreciation rate for the city of South Bend for the time period it uses when calculated in the same manner, which is +42.9%.
So it boosts South Bend real estate in a confused manner, making it seem that “wow, homes are increasing in value” not the more accurate “wow there were a lot of low price sales and those are becoming a smaller part of the market.” Both are good news, but quite different. And South Bend and its nearby cities and partners in the statistical area have enough great stories to tell that they don’t need muddled if positive statistics. I’ll try to cover a few of them in coming posts, they include: progress towards new mixed use buildings in central South Bend and Mishawaka, renovation of at least one midrise building in South Bend, a quick buildout of The Triangle neighborhood south of Notre Dame, and a significant rise in higher-end new construction homes in two South Bend neighborhoods.