Lots of listings are expiring, six months after Spring contracts were signed. Despite this, there are still 2,733 residential properties for sale in the area’s mls with an asking price just over 408 million dollars.
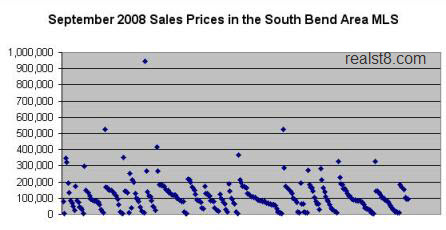
In September, there were 274 sales, for $30,233,646. Check the scatter graph for the price breakdown.
There were just a handful of condo sales:
- Two at Irish Crossings, for $415,941 and $350,859
- Two at The Forest in Mishawaka, each for $170,000
- Two at Woodbridge, for $97,200 and $81,900
- One at Somers Square, for $128,000
Nothing has sold in Oak Hill since June despite 8 listings now for sale (after one expired today). They are priced $164,500 to $229,500, clustered around $175,000. Oak Hill sellers, it looks like it’s time to drop your prices.
Overall, sales for the year remain slow compared to years past. However September 2008’s sales volume was about 8% less than September 2007’s (see the comments for a note on an earlier version of this article with a mispublication). Here’s the graph for sales volume since September 2001:

As always, if you need greater insight into the market, or specific real estate services, don’t hesitate to contact us. There is more to know than we can fit in any post, and we’d be pleased to speak with you.
What would be helpful are larger or expandable graphs and graph on unit sales numbers over the years, not just dollar amounts because of inflation. Much thanks and keep up the good work.
Is 2008 on that graph? Hard to see where a line stops in September.
Also, it appears that Irish Crossings had 2 of the largest sales out of the top 7 for September 2008. Impressive.
Also, are houses selling for $0 or does it just look like that on the scatter graph?
Point well taken, the month over month graph is hard to read, I’ll post a larger version soon. In fact, I misread it and have a correction – September 2008 sales are down about 8% from September 2007. The figures were $30,233,646 (9-08) and $32,790,889 (9-07). They were very similar to September 2001’s $30,881,830. Excel graphed all three years in shades of blue and I’ll try to tweak that default setting before posting the full graph and data set.
17 homes sold for $10,000 or less last month:
$2,900
$4,500
$4,900
$5,000
$5,500
$6,000
$6,500
$7,000
$7,000
$7,500
$7,502
$8,026
$8,500
$8,500
$9,500
$9,900
$10,000
On a graph that scales to $1,000,000 to account for a single high price sale, those look like $0.
I guess we’re back to 2001 sales numbers now that Culp-DePalma-Riffle aren’t buying any more houses. I suppose there were others like that that had to stop buying houses too since it is hard to do in jail. Even the Michiana market was hit by fraud. The 2001 sales numbers are probably what will occur going forward. Our area’s mini-bubble was mostly based on easy credit and fraud. Still people weren’t flocking to live here like CA, FL, NV, and AZ which were the big bubble markets. I have seen that some of the larger leveraged builders out there are pulling all the stops on sales gimmicks to create a false sense of urgency to buy. There is no rush, prices will stay low for a long time so any “employee pricing” sales gimmick is just that a gimmick. Wait it out and you’ll get an even better price later.
I’d like to see stats on all the ND oriented projects, not just Oak Hill.
– Oak Hill
– Jamison Condos
– Jamison House
– Stadium Club
– Keenan Court Townhomes
– North Douglas Condos
– Dublin Village (sold out so resales)
– The Wexford Place (sold out so resales)
– Waterford Estates Lodge
– Pendle Woods
– Woodbridge Condos
– Woodbridge Villas
– New London Lake
– Irish Crossings
– Stadium Village Townhomes
– River Point
– North Shore Club
Are any of these things selling?
I agree that to date, it looks like the best preforming development in the higher end price range is Irish Crossings.